by Kim Lamb Gregory
Interpreting numbers, statistics and other forms of data can be intimidating, especially if you’re not a scientist or computer engineer. Which is why the field of data visualization is rapidly expanding in the global workplace.
“Data visualization is basically putting data into a graphic format that’s easy to understand for people who don’t have anything to do with data,” explained CSU Channel Islands (CSUCI) Associate Professor of Marketing Ekin Pehlivan, Ph.D.
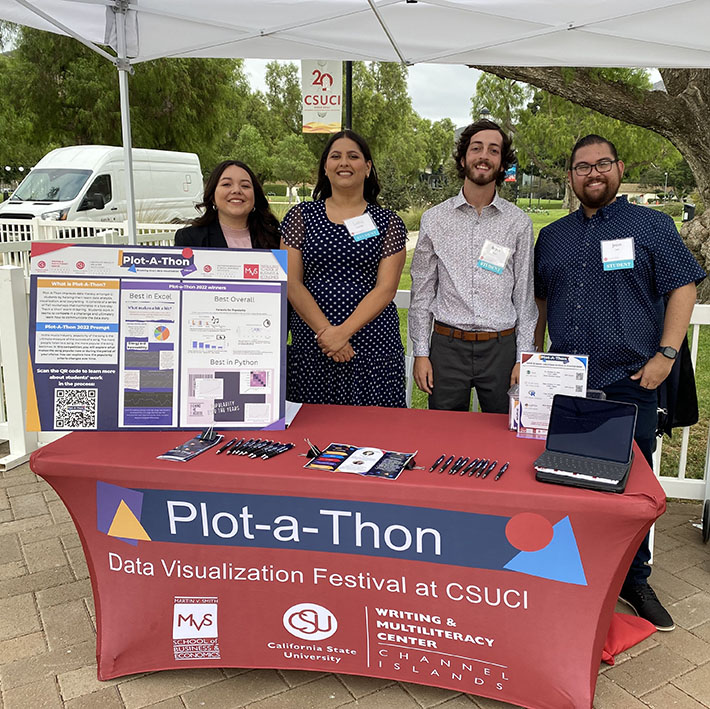
In an effort to better familiarize and teach students about data visualization, CSUCI is hosting a Plot-A-Thon beginning Friday Feb. 24 at 11:30 a.m. through Saturday, Feb. 25 at 4 p.m., when prizes will be awarded. There will be a kickoff event on Thursday, Feb. 16.
“We start the Plot-A-Thon on Friday afternoon,” explained Assistant Director of the Writing & Multiliteracy Center (WMC) Daniel Lenz, Ph.D. “We’re keeping the library open from sundown through the night while the teams of three put together and submit their data visualization project. The winners are announced Saturday and there will be cash prizes.”
The WMC is coordinating the event with community sponsorship from The Trade Desk and HubSpot Academy. There are different categories for the winners, such as Best Data Visualization, Best in Communication, Best in Python (a popular programming language), etc.
This is the third annual Plot-A-Thon, but it is the first Plot-A-Thon to be both virtual and in-person since the event was launched in 2021, according to Associate Professor and Faculty Director Writing & Multiliteracy Center Sohui Lee, Ph.D.
“This will be the first time that we actually provide the ‘hack-a-thon’ features we originally envisioned, like providing a physical space in Broome Library for teams to work overnight, and crash if they want to,” Lee said. “We will have food and snacks, and opportunities for casual in-person networking with fellow Plot-A-Thoners, staff, and faculty.”
Lee is responsible for creating and launching the event after a brainstorming session with Assistant Professor of Computer Science Scott Feister, Ph.D., and former Digital Archivist Beth Blackwood. Pehlivan then got involved to help shape the event, which is open to CSUCI students and alumni from all majors.
“In the past few years we’ve had students from 17 different majors participate,” Pehlivan said. “In the first iteration, we had students say at the end ‘I was intimidated and scared because I thought data was this nebulous thing. But it’s not as intimidating as I thought!’
Examples of data visualization could range from. a heat map showing the potential spread of COVID to a pie chart with slivers and slices showing how long dinosaurs or humans have been around in comparison with the age of the earth. There might be video, or an interactive element or numerous other creative graphics to illustrate the statistics.
“Every four years you’ll see the media provide a red and blue Presidential election map that shows which way people are voting,” Lee gave as another example. “These visualizations help viewers quickly identify voting patterns based on geographic location. Color-coded maps like these can help us ‘see’ the trends more easily than if we listed all 50 states and identified a political party.”
Maps, charts and graphs make visible the clusters, patterns and trends that would otherwise be invisible, Lee explained, adding “This is a magic of data visualizations.”
There are workshops and both student and faculty recruitment events to help prepare for the event, which usually attracts more than 100 competitors who divide into three-person teams.
Provost Mitch Avila, PhD., will welcome participants to the kickoff event at the John Spoor Broome Library on Feb. 16 is from 5 to 8:30 p.m.
Aside from meeting their teammates, competitors will have the opportunity to hear speakers, who include Director of Hubspot Academy Courtney Sembler; HubSpot Senior Program Manager Cheyenne Boyce and The Trade Desk Director of Business Intelligence Mic Farris and Business Intelligence Specialist Christi Williams.
President Richard Yao, Ph.D., and Library Dean Alicia Virtue, Ph.D. will welcome students and faculty to the main event beginning Friday and the main speaker later in the day will be Rachel Olney from Geosite.io and Eddie Schlafly from the Space Telescope Science Institute. The Dean of the Martin V. Smith School of Business & Economics Susan Andrzejewski, Ph.D., will welcome students on the final day of the Plot-A-Thon.
To find out more, visit: https://csuci-7974604.hs-sites.com/plot-a-thon-home-page-0 .