For Cal State Channel Islands’ first two decades, enrollment growth had been steady and reliable with thousands of new students and families attracted to our campus – the only four-year public university in Ventura County. But the higher education landscape has changed significantly in recent years, impacted by economic, demographic, political, and societal shifts.
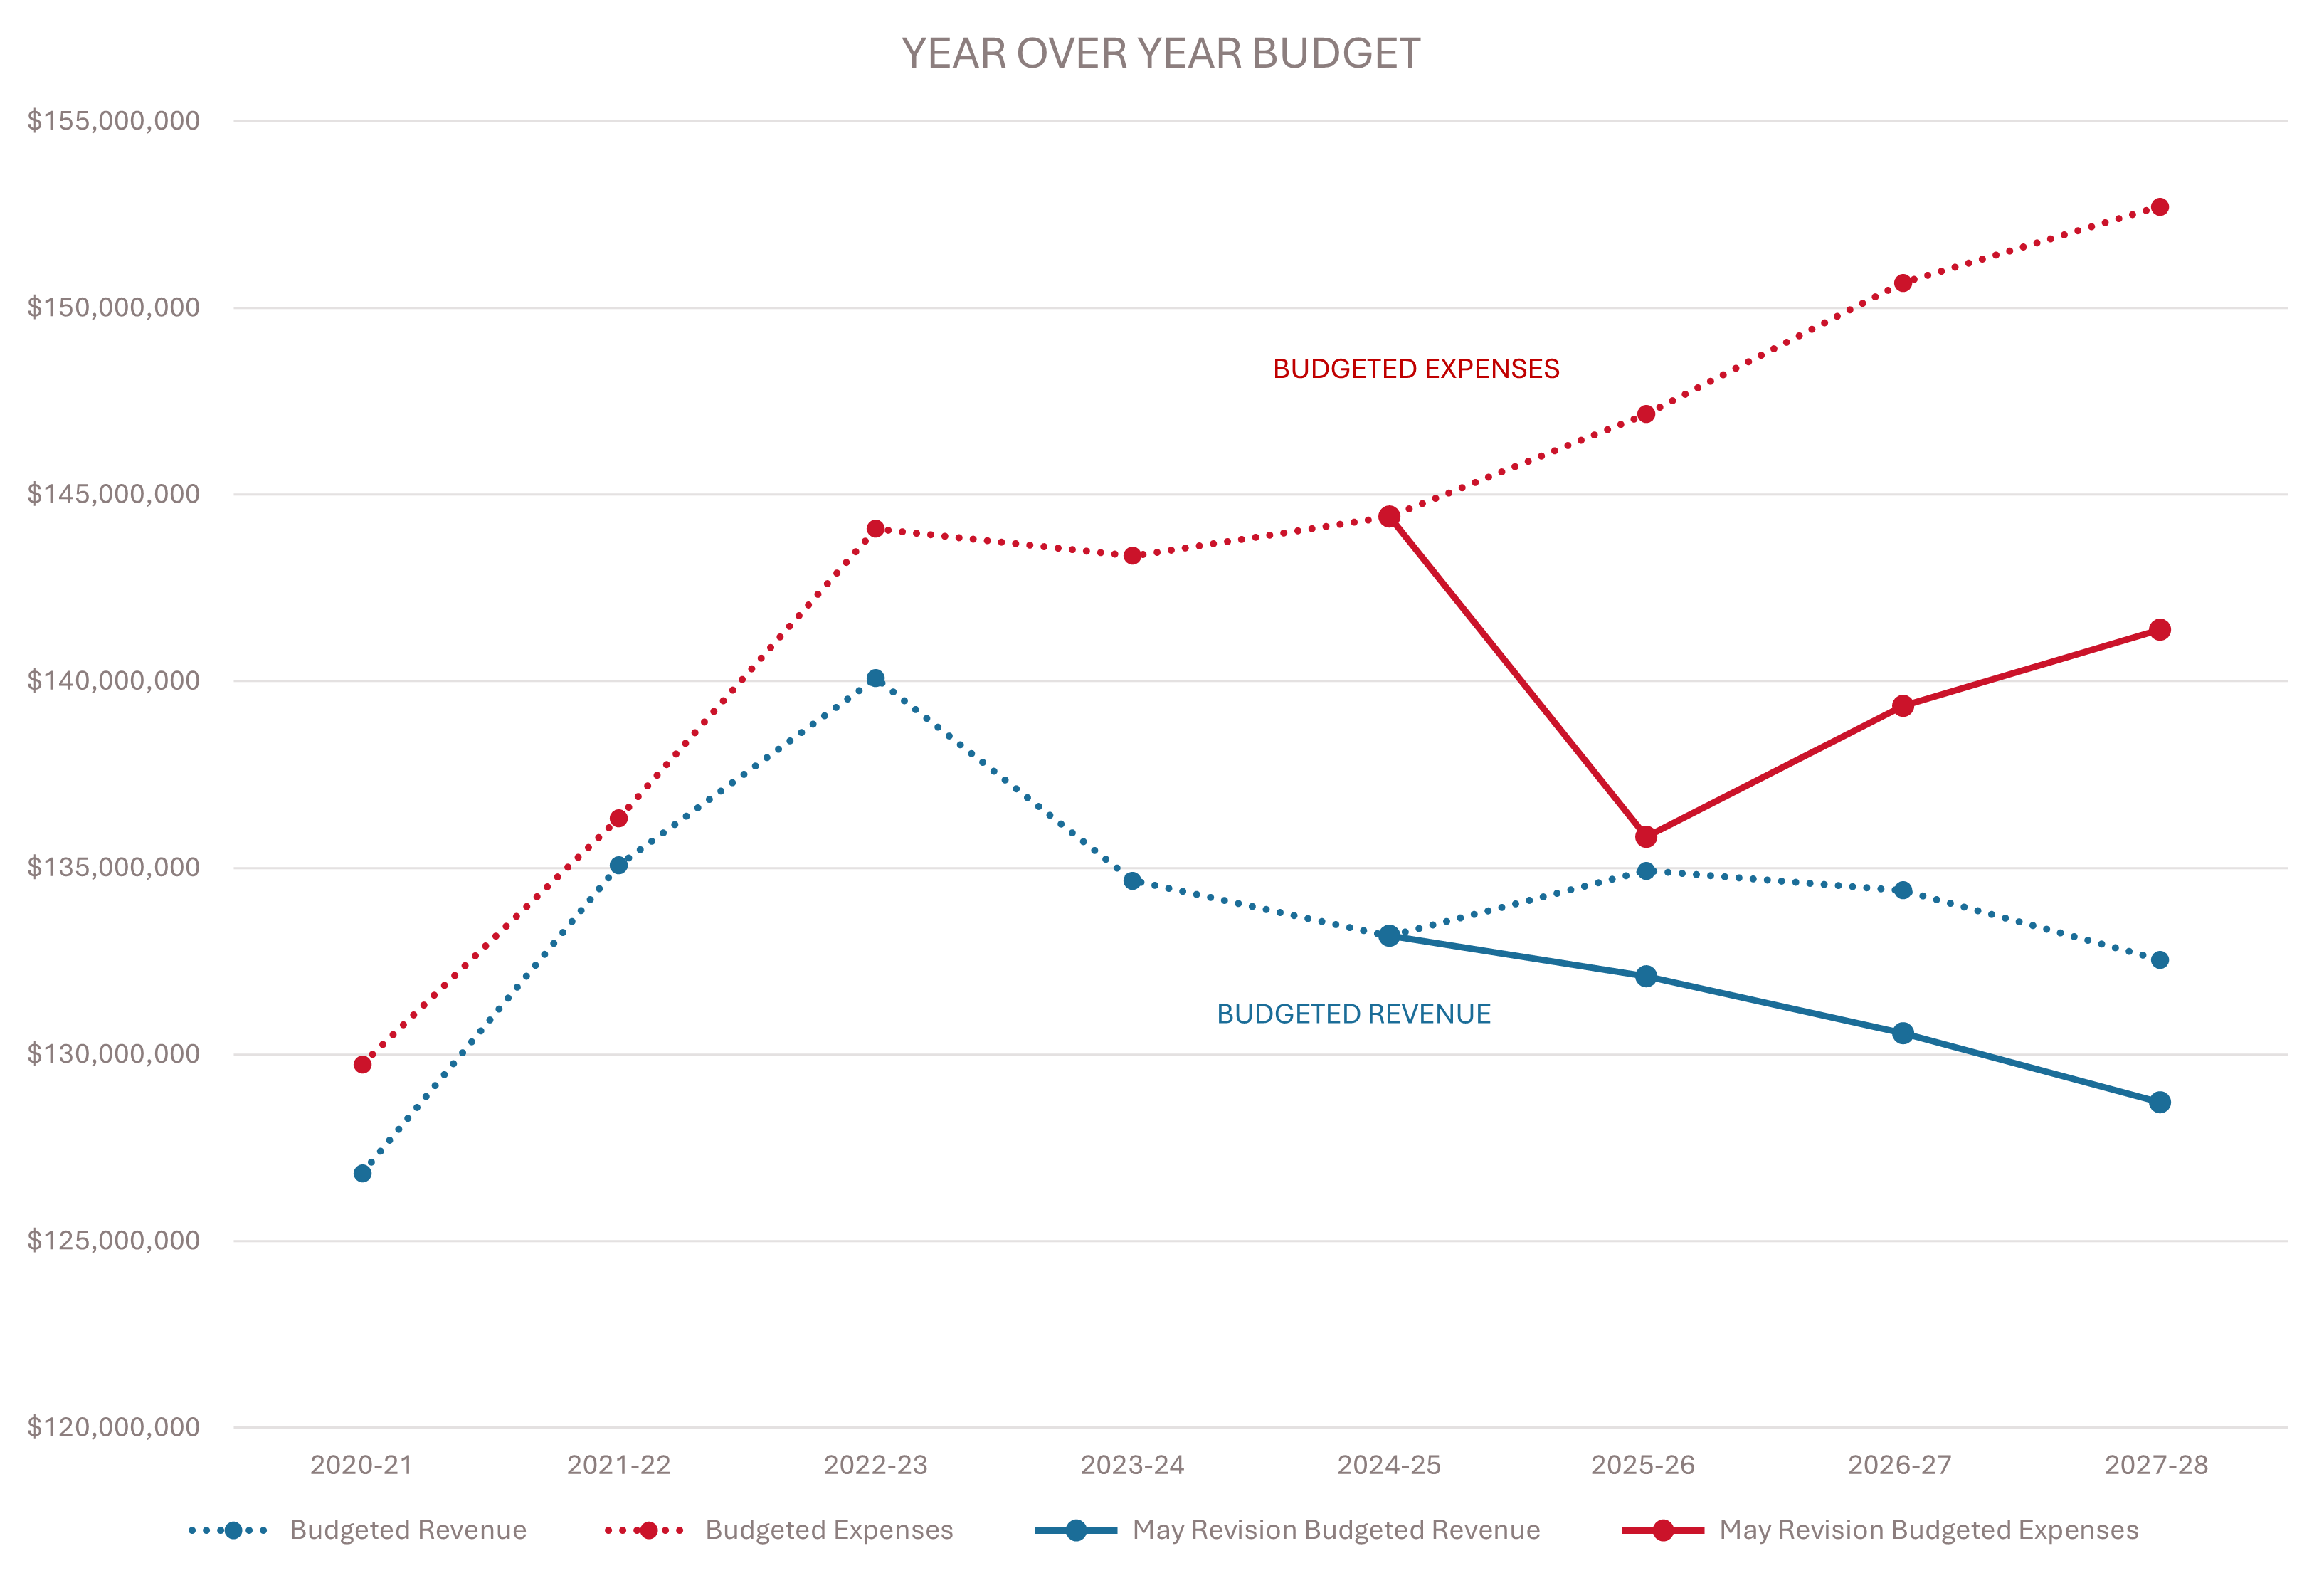
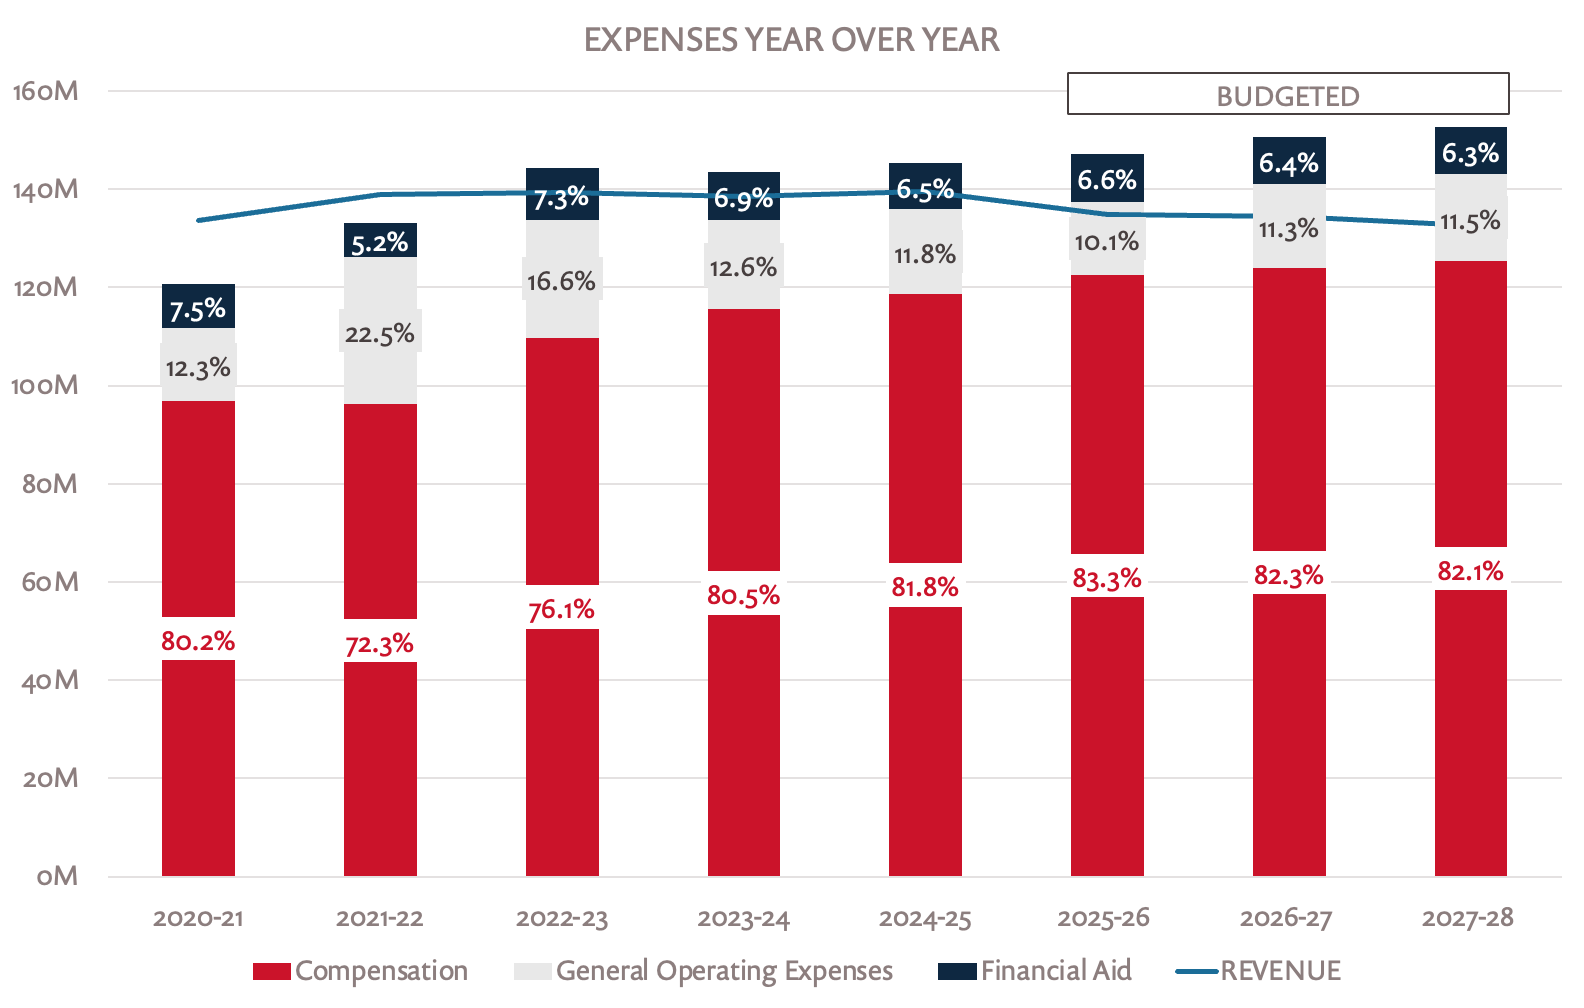
For the past five years, our budgeted expenses have consistently outpaced our budgeted income. While we have been able to reduce the overall impact in our actual numbers – initially through Covid (via the Higher Education Emergency Relief Fund) funding and later through budget cuts across the institution, we have nevertheless been forced to dip into our economic uncertainty reserve funds each year since the 2022-23 academic year. This recurring gap can no longer, nor in good faith, be considered a temporary budget shortfall, but a structural deficit that will be further exacerbated by significant State budget cuts going into effect this year.
The following charts reflect these challenges. The first chart shows our budget each year from 2020-21 and projected through 2027-28. It includes one-time expenses and revenues as well as the latest guidance from the CSU. The red dotted line shows the increase in projected expenses if we had not completed the workforce reduction plan. The new red solid line shows the projected expenses based on the recent reduction in employees as well as updated projections since the May Revision.
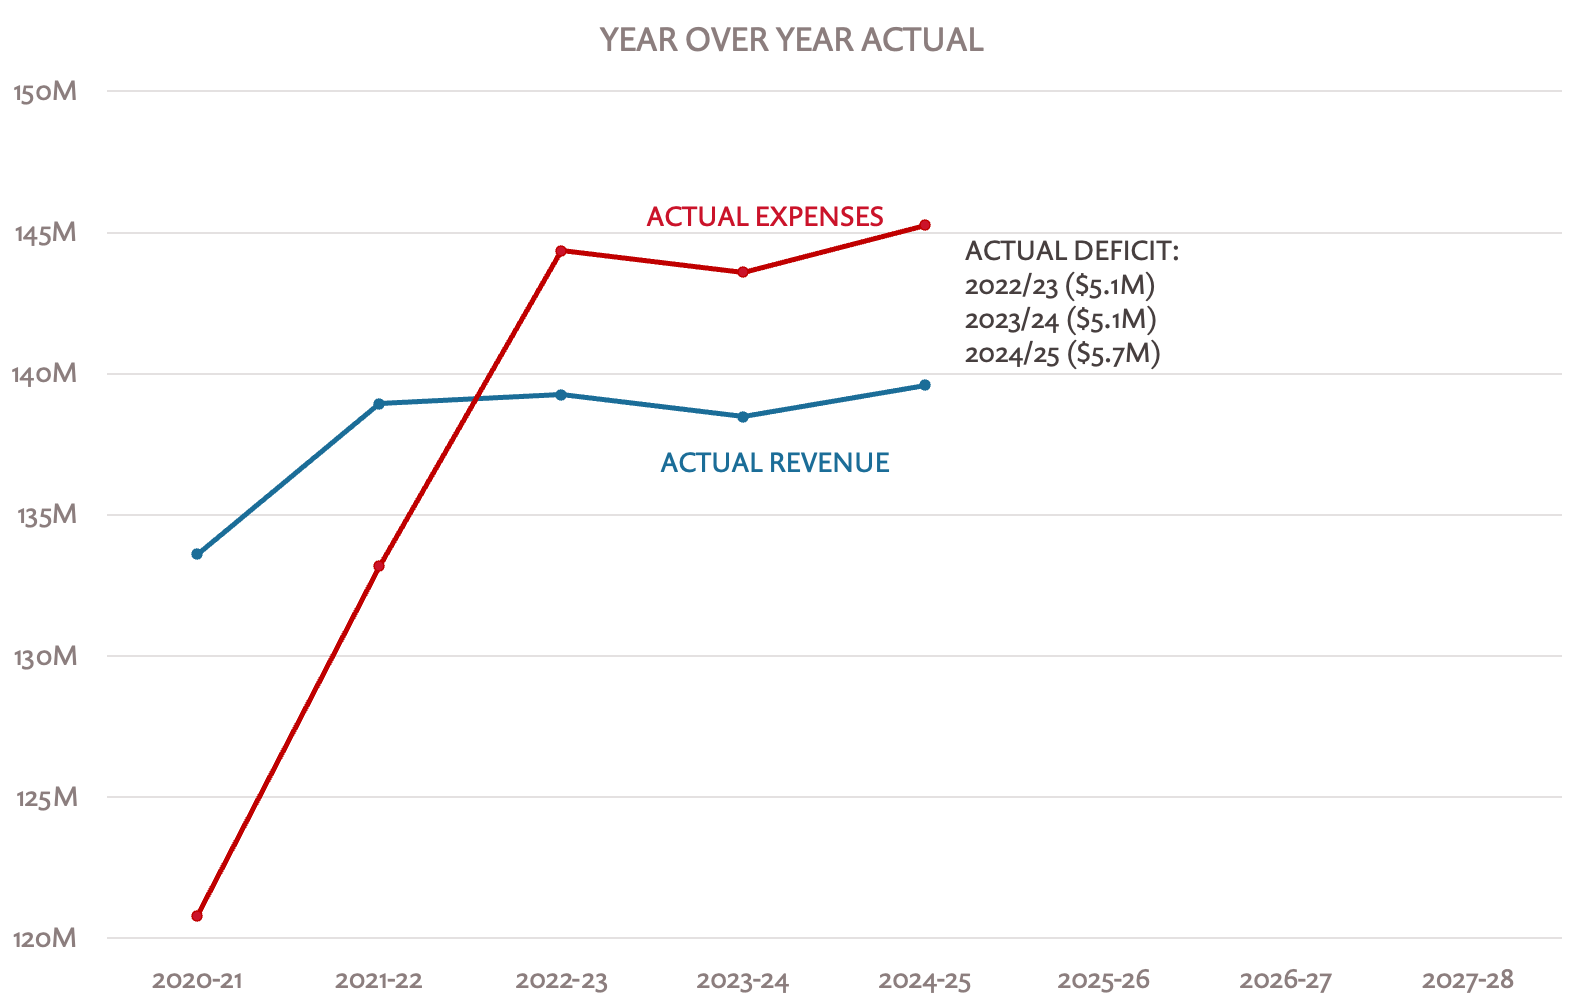
This second chart demonstrates that even with the expense reductions we were able to find across the institution, our actual expenses outpaced our actual revenue by just over $5M in 2022-23 and 2023-24 and is expected to do so again this year by $5.7M. Even though the workforce reduction did reduce expenses by $10.4M, the impact on the deficit is less for a number of reasons including 1) the costs for the early retirement and early exit program continuing into next year; 2) there are increases in other mandatory costs, including salary and benefits; and 3) the graduating class of ‘25 was larger than the incoming class, reducing overall tuition revenue.
 Enrollment Impacts
As evidenced by the CSU Enrollment Dashboard, over the past five years Cal State Channel Islands has experienced a 35% drop in Full-Time Equivalent Student (FTES) enrollment. Further, retention rates of just over 71% for first-year students are not where we want them to be. Today, we enroll just over 4,000 FTES compared to a peak of more than 6,400 in 2019.
 Only 35% of students admitted to Cal State Channel Islands end up enrolling here and
many of the other admitted first-year students choose other CSUs. Recruitment and
retention are areas of focus as we work to change this pattern.

Cal State Channel Islands sees more admitted first-year students enroll elsewhere in the CSU system than any other campus – likely a result of the shared application, which lets students apply broadly at no extra cost, even to campuses that may not be their first choice.
 This drop in enrollment impacts us in two important ways:
- Directly Through Reduced Tuition & Fees: Although not to the same extent as private colleges, our institution, like many, is dependent on the revenue that we receive from tuition and fees, and
- Indirectly Through a Resident Target Reallocation Cut: Beginning in 2024-25, the CSU altered its approach to enrollment target-setting and resource allocation. Campuses experiencing enrollment declines will have a percentage of their resources reallocated to universities that are reaching or exceeding enrollment targets.
General Fund Allocation
Support from the state is unpredictable and is subject to change. Beyond the known deferral of increases promised by the “Compact,” we expect significant state budget cuts will go into effect this year. Our current budget planning anticipates an approximate cut of 3% to our General Fund Allocation, as referenced in Governor Newsom’s May Revise. This amount has not yet been formalized by the State Legislature, which has until midnight on June 15 to pass its budget bill for the next fiscal year.
Increasing Costs
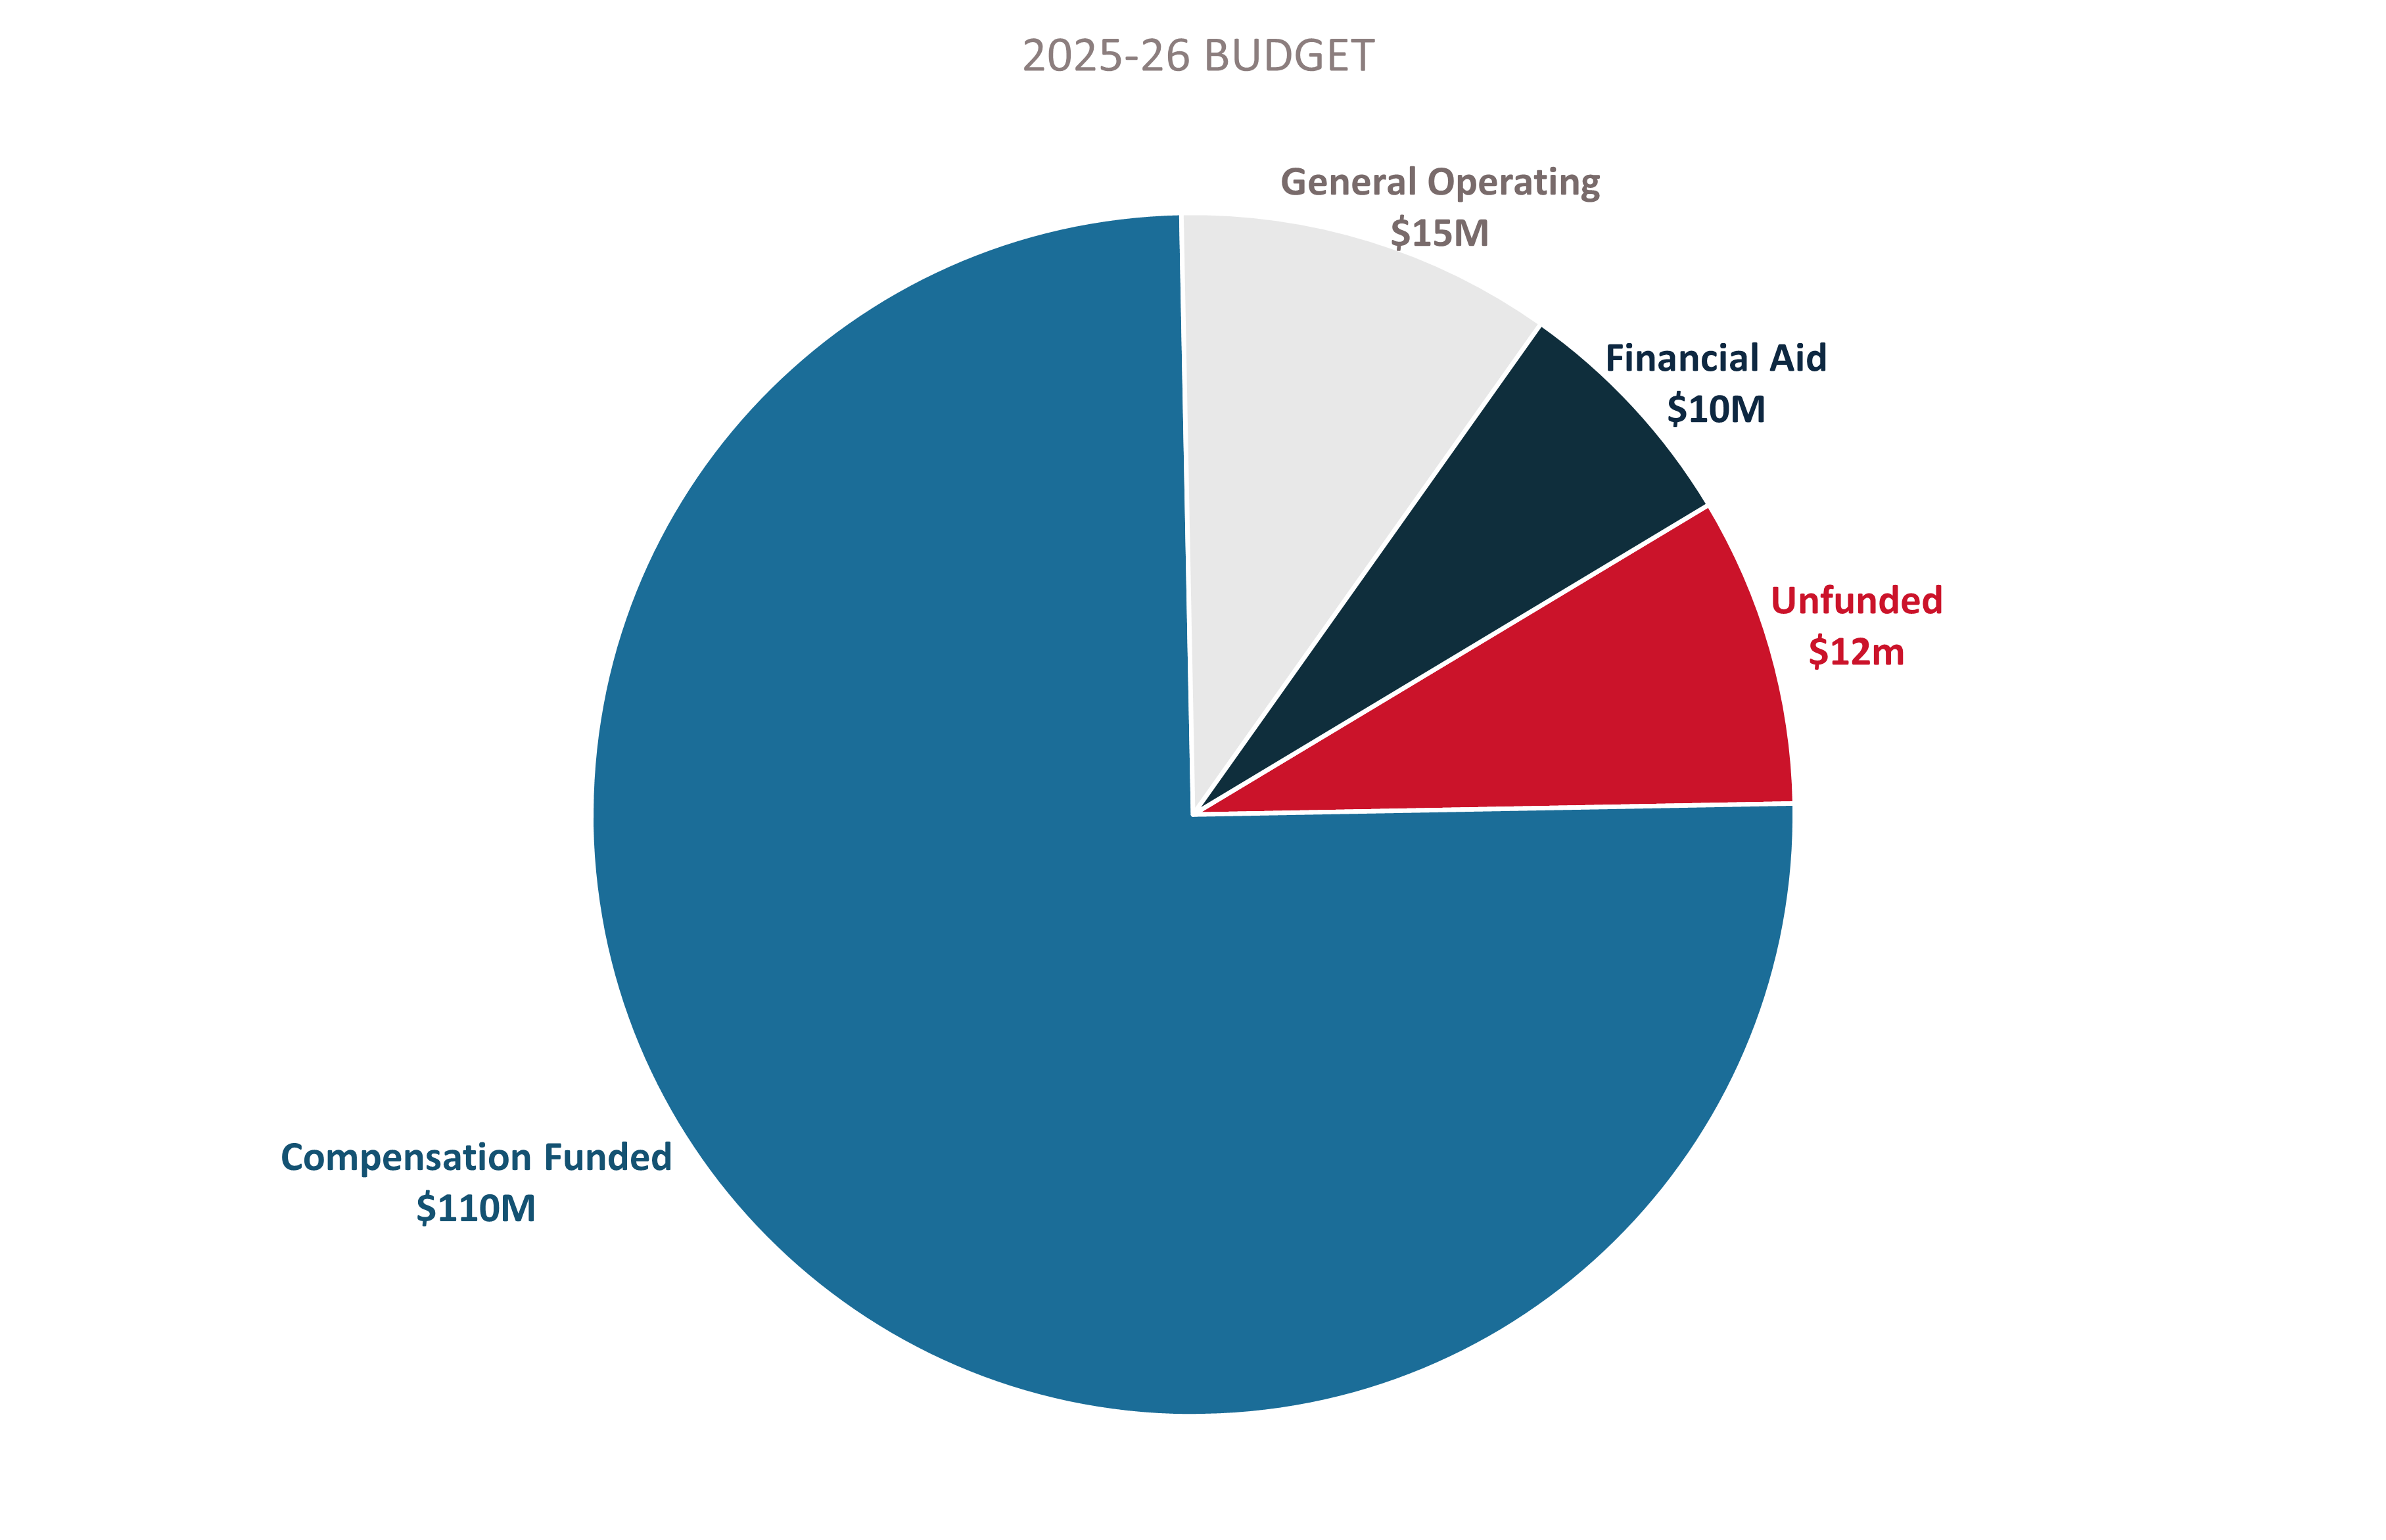
At the same time that revenues are decreasing, we are also experiencing rising costs, which highlights the importance of strategic financial planning. For the 2025-26 school year, we are budgeting “mandatory costs” such as increases in salaries, benefits, property and liability, and compliance requirements to increase by approximately 3.7% which contribute to a $12M budget shortfall – the gap between our projected revenues and expenditures.
 At CI, increasing cost pressure is exacerbated by characteristics that are unique
to our institution, even amongst our peer institutions. Based on work at the system
level that has been underway for more than two years to assess the costs of instruction,
academic supports, student services, and institutional operations, we are an outlier
in the CSU System. For example, we spend approximately $12,851 – or 61% – more per
full-time equivalent student compared to the systemwide average, and $2,701 more per
FTES when compared to the average of the smallest universities in the system.

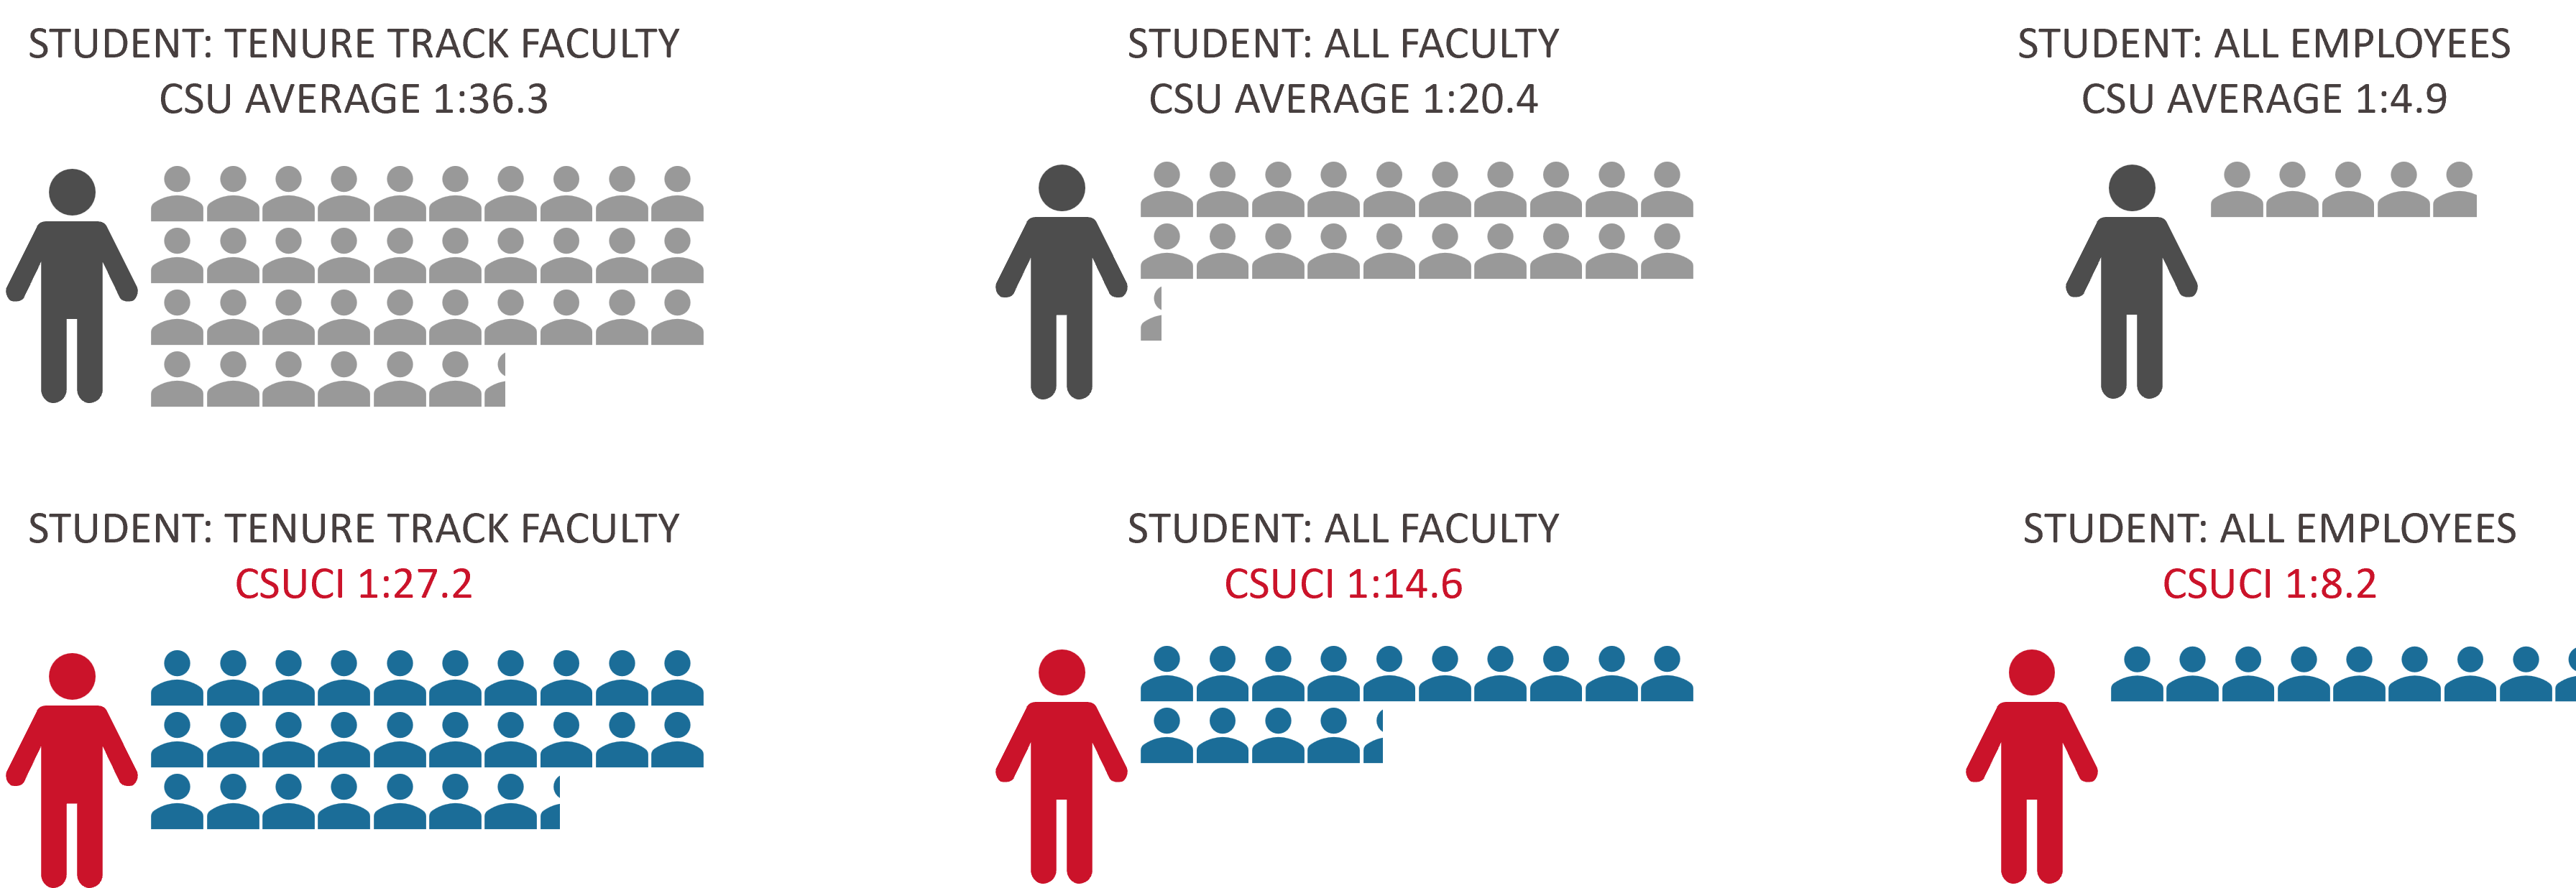
Likewise, our student-to-faculty and student-to-employee (i.e., faculty, staff, and administrator) ratios are significantly lower than other CSU campuses.
 Simply put, Cal State Channel Islands is spending more money and allocating more resources
per student than other CSU campuses. While the intention is admirable, focusing on
this distinction may not be the most effective way to support our campus’s growth
and success. In reality, it keeps us operating at a deficit and from the perspective
of the CSU System, reveals Cal State Channel Islands as an outlier that needs to bring
expenses back in line with peer schools of similar size and regional focus.
Compensation
Salary and benefits routinely account for over 80% of our expenses and have been increasing. Last year, just 11% went to operating expenses and 6% to support financial aid. As a result, when it becomes necessary to reduce expenses, the available options are limited, underscoring the need for thoughtful prioritization.
Diminishing Reserve Funds
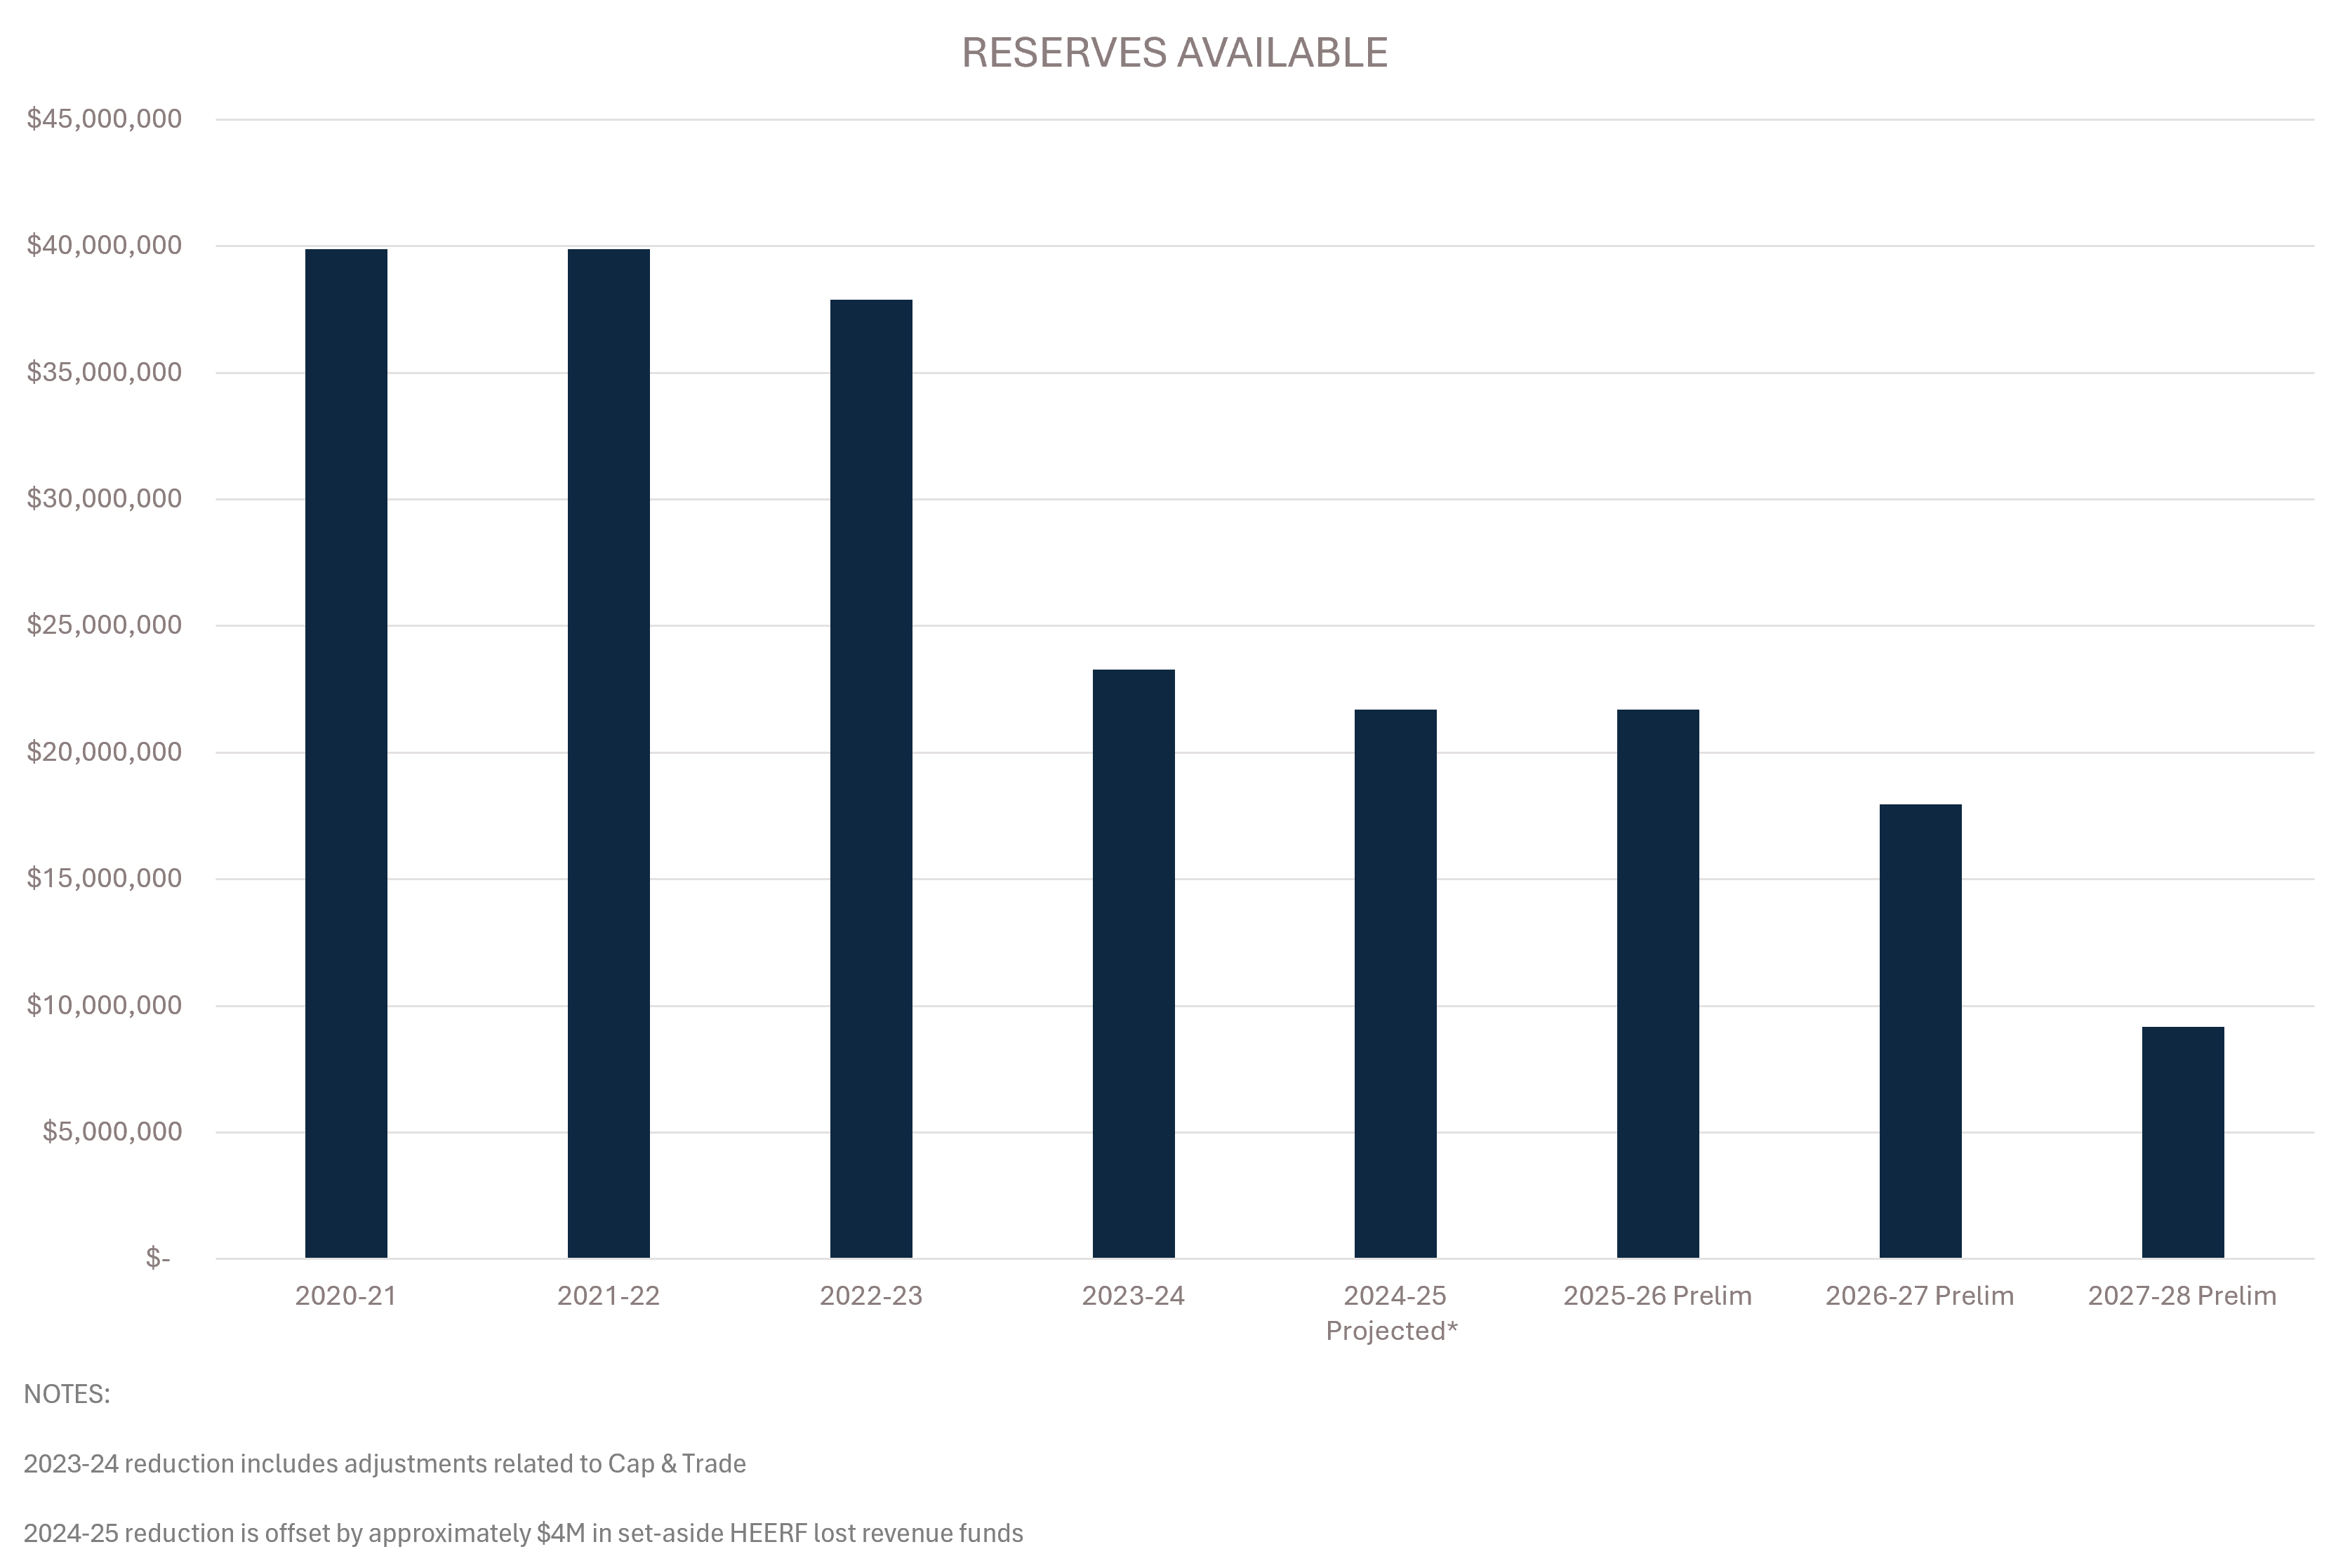
Since the 2020-21 academic year, our budgeted expenses have exceeded our budgeted revenue. This became an actual deficit in 2022-23. As a result, each year since we have needed to tap into our economic uncertainty reserve funds. The equivalent of a family’s “rainy day” savings, our economic uncertainty reserve is intended not to be a year over year source of funding but as a hedge against economic uncertainty. Based on expert recommendations, this fund should hold between three- and six-months’ operating budget.
We shared our concerns earlier this year that were we to continue on the current trajectory without taking action, our reserve fund would have fallen not just below the recommended holdings but precariously close to the minimum 5% of operating budget required by CSU policy for the 2026-27 fiscal year, meaning there would not be sufficient funds to fully cover any deficit.
Although we were able to significantly reduce our anticipated deficit this year through our community’s cost-saving actions, we are still projecting a deficit of almost $5.7M reducing our economic uncertainty reserve to approximately $21.7M – below the expert recommended level.
On top of that, state funding reductions – even the recently revised ones – still have us tracking to nearly deplete our reserves in the 2026-27 academic year. The chart below reflects the situation if no additional steps are taken.
We are committed to providing our community the most accurate, precise, and up-to-date financial information available. This is a fluid situation, however, that will not be settled until the enactment of the state budget in July. As the situation changes, we pledge to provide updated information.
